
LipiDye II, Lipid dye Droplet Staining
DiagnoCine offers excellent reagents for Lipid Droplet, Lipid Staining, Lipid Dye and Lipid Metabolism research.
LipiDye II, Lipid dye Droplet Staining
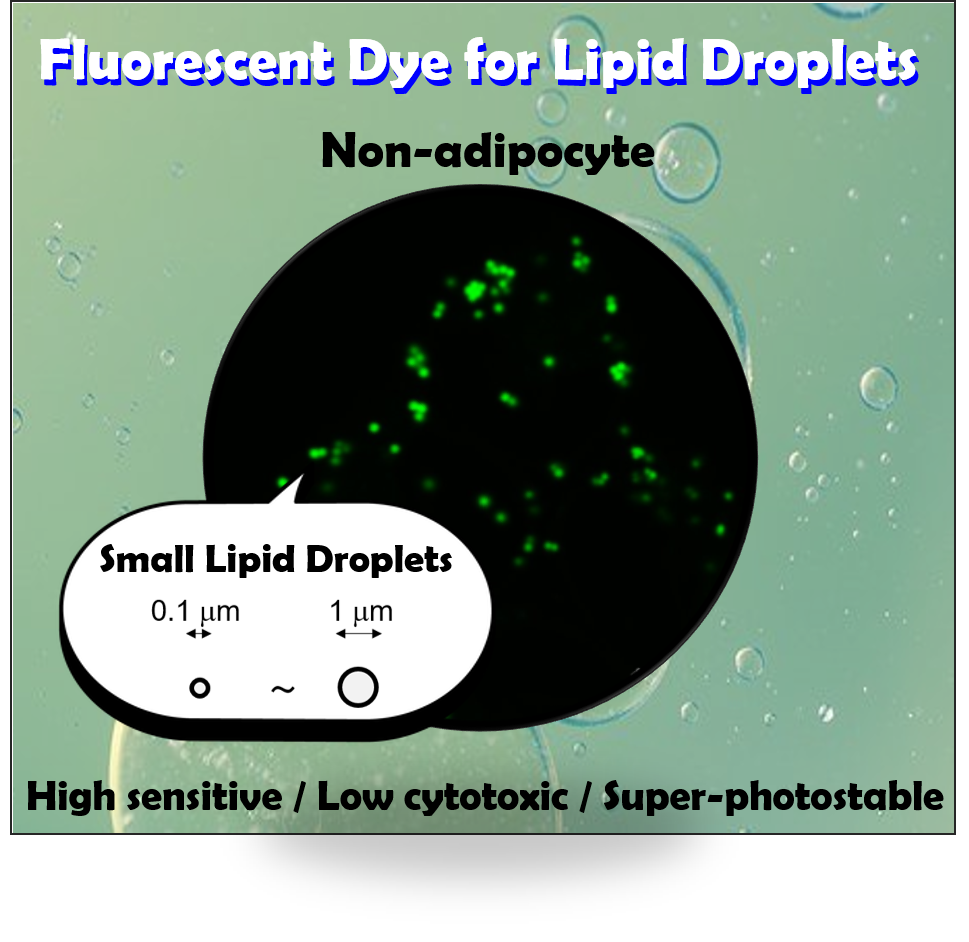
Live imaging fluorescent dye for lipid droplets (LDs)
Description
- Catalog Number: FNK-FDV-0027
- Size: 0.1 mg
- Formulation: C26H17NO2S2
- Molecular weight: 439.5 g/mol
- Solubility: Soluble in DMSO
- Fluorescent characteristics:
- Ex. 400-500 nm (maximum ~420 nm)
- Compatible with blue excitation lasers (ex. 405, 445, 458, 473 and 488 nm* lasers, etc.), Xenon lamp or
- LED with commercial FITC or GFP filters.
- *Note 488 nm laser can excite LipiDye II but shows weak fluorescence compared with 473 nm excitation.
- If using 488 nm laser, please empirically optimize imaging conditions such as dye concentration etc.for your experiments.
- Em. 450-650 nm (dependent on solvents)
- Maximum ~510 nm in soybean oil similar to LDs. Around 490-550 nm range is recommended.
| tip | The Best Match Bundle Products for Lipid Metabolism Research | LipiDye II, Lipid dye Droplet Staining with FAO Blue (Fatty Acid Oxidation Detection Reagent |  |
Product Background
What is lipid droplets (LDs)?
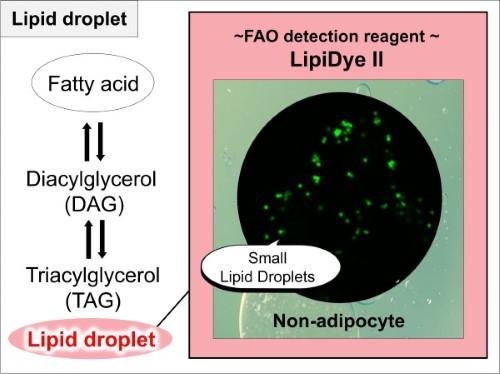
LDs are produced from the endoplasmic reticulum (ER), exported to the cytoplasm and expand via fusion of LDs or incorporation of additionally synthesized neutral lipids. LDs contact with various organelles including ER, mitochondrias, lysosomes, nucleus and shows dynamic movement inside the cells.
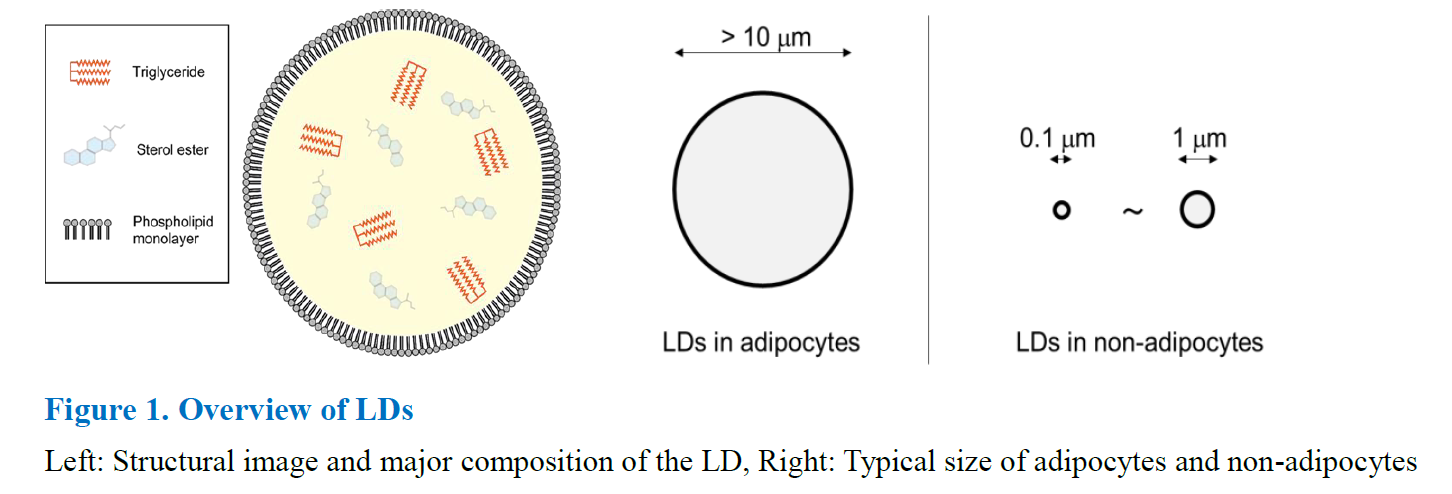
Problem of conventional LD dyes: stability, sensitively, selectivity etc...
LipiDye II is an innovative dye for advanced LD research
Features
- High S/N ratio: Low background in cytoplasm via following two features
1) Specific accumulation into LDs
2) Strong green fluorecent emission in non-polar oil phase like LDs - High sensitivity: Can observe even very small (<1 μm) LDs
- Super photo-stability: Long-term live time lapse imaging is possible
- Low cytotoxicity (at the recommended concentration (0.1~1μM))
- Compatible with both live and fixed cell
- Applicable to STED microscopy: can detect less than 500 nm LDs in HeLa cells.
Fluorescent Characteristics
- Ex. 400-500 nm (maximum ~420nm)
*Note
488nm laser can excite LipiDye II but shows weak fluorescence compared with 473 nm excitation. If using 488 nm laser, please empirically optimize imaging conditions such as dye concentration etc. for your experiments.
- Em. 450-650 nm (depend ent on solvents)
Superiority of LipiDye

Reconstitution and Storage
Reconstitution: Stock solution recommended concentration 1 mM in 100% DMSO.
- Reconstitute 0.1mg of the dye in 227.5ul 100% DMSO.
- After adding 227.5 µL of DMSO, briefly vortex the vial or pipette up and down to ensure the dye is completely dissolved.
- Once reconstituted, it is often best practice to aliquot the stock solution into smaller volumes to avoid repeated freeze-thaw cycles.
Storage (solution): After reconstitution in DMSO, aliquot and store at -20°C. Avoid repeated freeze-thaw cycles.
How to use and experimental setting
General procedure for live cell imaging
1. Prepare 1 uM LipiDye II in serum-free and phenol red-free medium such as DMEM

Reference data
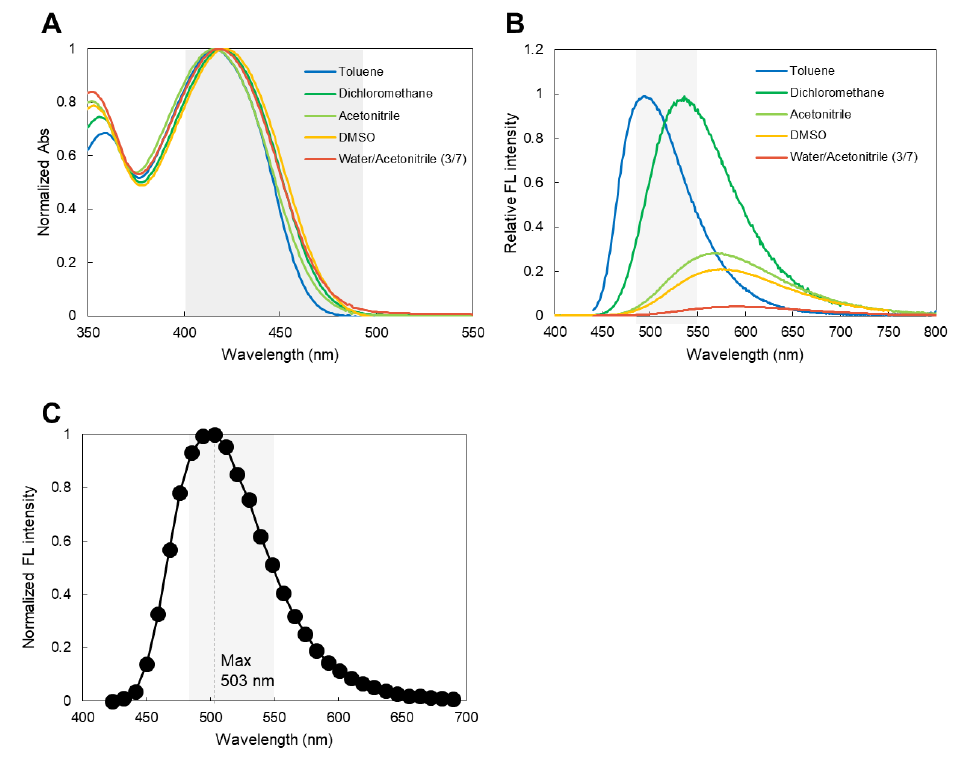
Spectrum of LipiDye II
(A) Absorption spectrum in various solvents.
(B) Emission spectrum in various solvents. LipiDye II is a solvatochromic dye and shows a different spectrum in
each solvent. Under low polaric solvents, toluene and dichloromethane, emits from blue to green fluorescence with
high quantum yield. On the other hand, under high polaric solvents, acetonitrile, DMSO and water, LipiDye II
exhibits a weak fluorescence intensity with a red-shift fluorescence.
(C) Emission spectrum in cellular LDs measured by fluorescent microscopy.
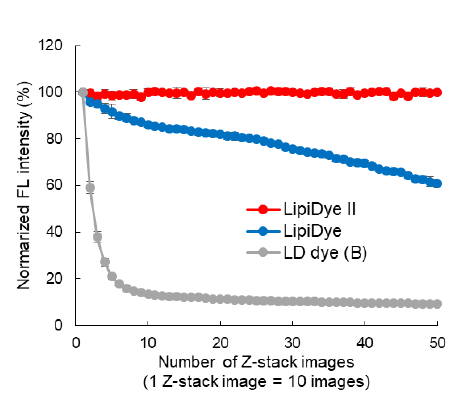
Photostability of LipiDye II in the cell
3T3-L1 adipocytes pre-fixed in 4% formaldehyde were stained with LipiDye II, prototype LipiDye and conventional LD dye (B). The free dyes were removed by washing and z-stack images (z=10 with a 2 um step) of the adipocytes in the same area were repeatedly acquired by confocal microscopy (Ex 473 nm/Em 490-540 nm). The total fluorescence was measured and normalized intensity was calculated. The fluorescent intensities from conventional dye B dramatically reduced by repeated light irradiation, including LipiDye gradually decreased. LipiDye II maintained its fluorescence at least 50 z-stack images (total 500 images).
Cytotoxicity of LipiDye II
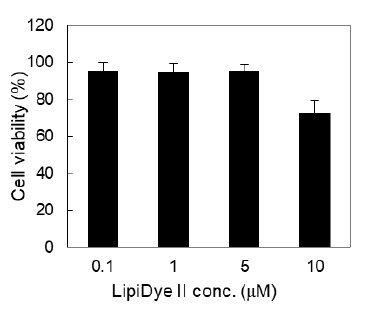
3T3-L1 adipocytes were treated with various concentrations of LipiDye II for 24 hours. After incubation, cell viability was evaluated by MTT assay. At least 5 uM showed little cytotoxicity on adipocytes. The recommended concentration of LipiDye II for LD-staining is 0.1-1 uM.
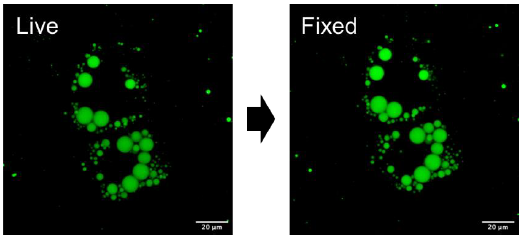
3T3-L1 adipocytes stained with LipiDye II and were observed under live cell conditions (left). After recording the live cell image, the cells were subsequently fixed with 4% PFA and observed by confocal microscopy (Ex. 473 nm/Em 490-540 nm). Fixation has little effect on the fluorescent intensity of LipiDye II. LipiDye II is compatible with any immunocytochemical experiments after the live cell imaging experiments.
Application data
| Staining of various cells |
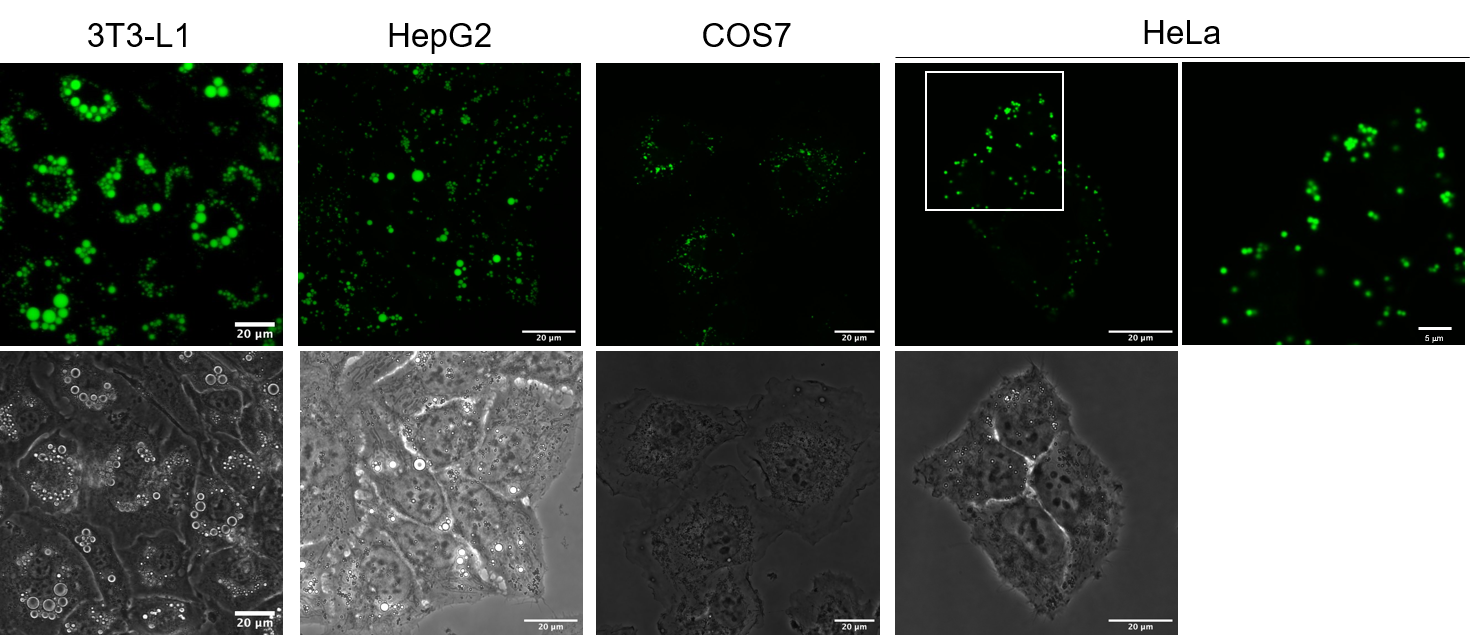 |
3T3-L1, HepG2, COS-7 and HeLa cells were stain e d with LipiDye II (1 µM) for 12 hours and observed by confocal microscopy (Ex. 473 nm/Em 490-540 nm). In the case of HepG2 cells were pretreated with palmitic acid (0.33 mM) /oleic acid (0.66 mM), one day before LipiDye II staining. In HeLa cells, small LDs of approximately 1 µM were clearly observed. (Scale bar: 20 µm, HeLa cell enlarged 5 µm). |
| Multicolor imaging with ER marker |
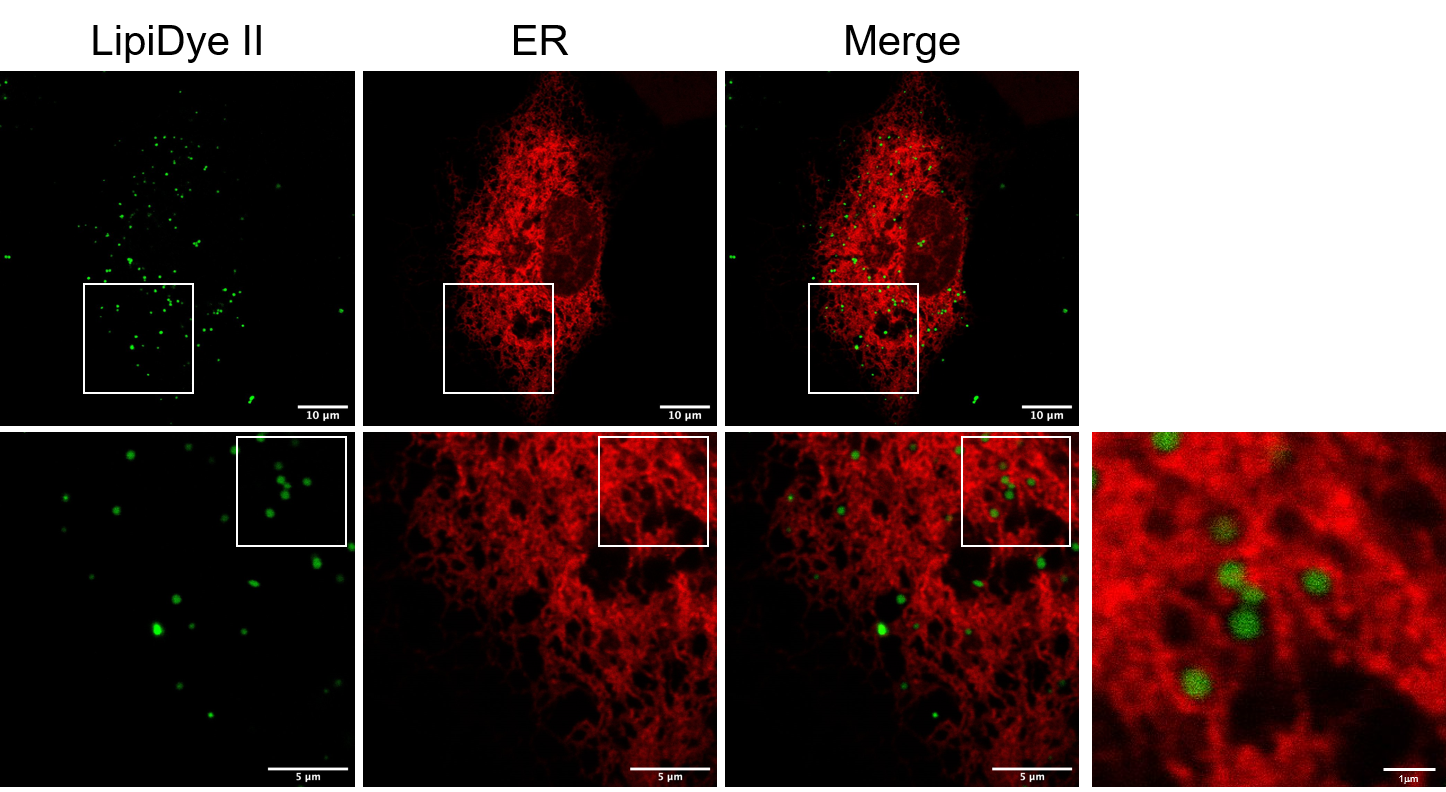 |
COS7 cells expressing ER resident fluorescent protein (mKO1) was stained with LipiDye II (1 µM) for 12 hours. After washing the cells were observed by confocal microscopy (LipiDye II; Ex. 473 nm/Em 490-540 nm, mKO1; Ex. 635 nm/Em 660-710 nm). Small LDs less than 1 µm were frequently observed in the network structure of ER (Scale bar: 20 µm, 5 µm and 1 µm) |
| Long term staining during adipocyte differentiation and maturation |
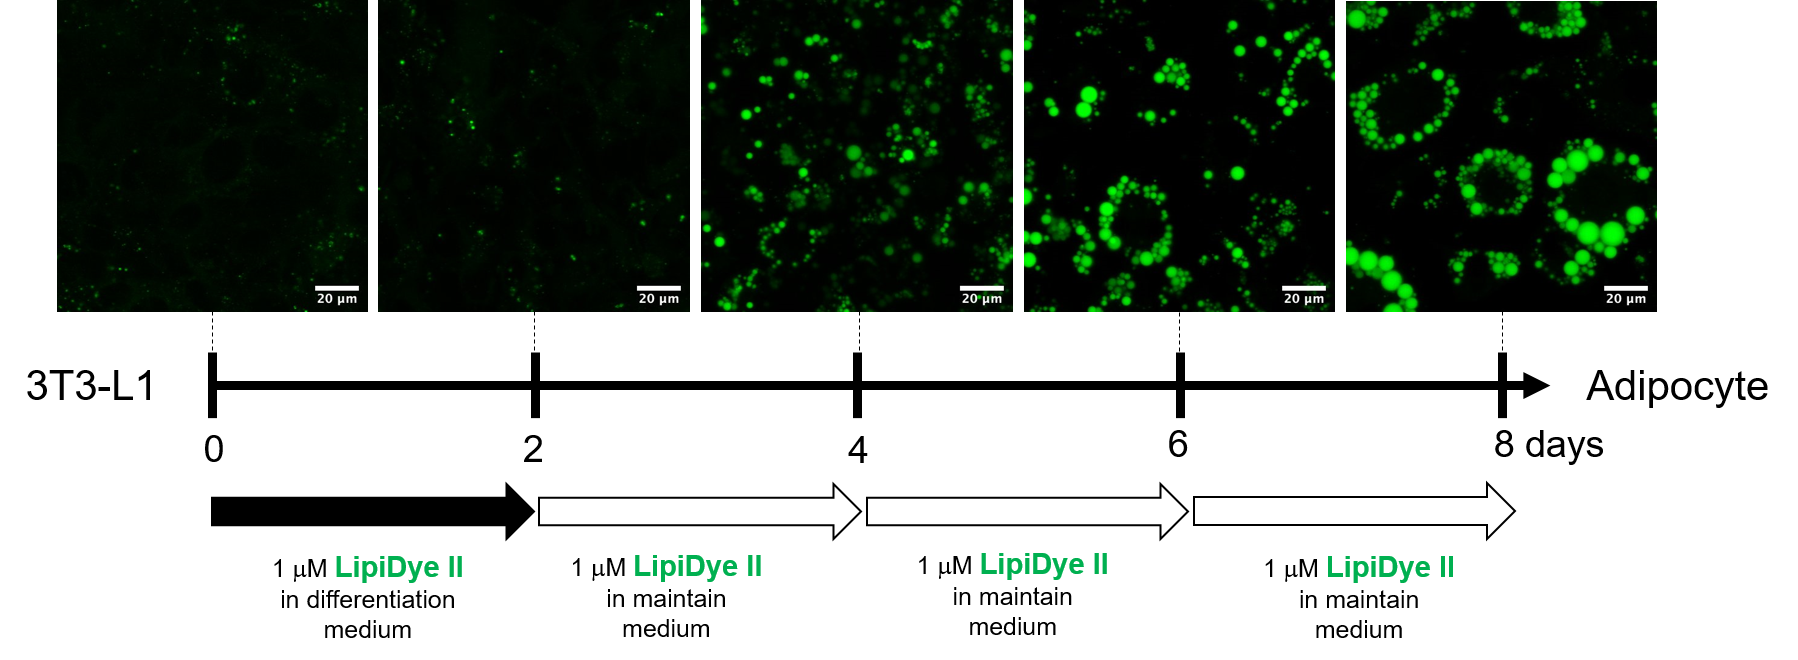 |
Two days after confluence, 3T3-L1 preadipocytes were stained with LipiDye II for 12 hours. After washing with fresh medium, the cells were incubated with a differentiation medium containing 1 µM LipiDyeII and the first image (0 days ) was recorded by confocal microscopy (Ex. 473 nm/Em 490-540 nm). After two days of differentiation, the medium was replaced with a maintenance medium containing 1 µM of LipiDye II. During acquisition of the images, the medium containing LipiDye II was exchanged every 2 days. (Scale bar; 20 µm) |
| Time-lapse Z-stack imaging of adipogenesis |
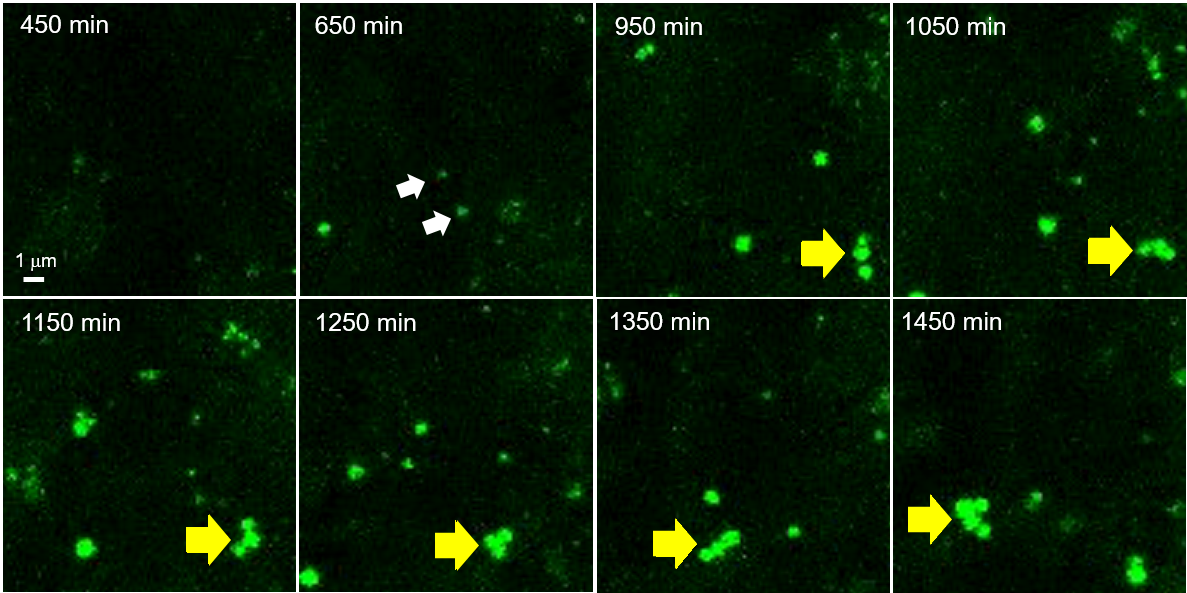 |
3T3-L1 preadipocytes cultured in differentiation medium containing 1 µM LipiDye II and time-lapse Z-stack imaging (20 z-images/10 min, for 24 hours) was performed by confocal microscopy (Ex. 473 nm/Em 490-540 nm). After ~10 hours differentiation, small LDs were observed (650 min, white arrows) and some LDs were docking with other LDs during adipogenesis (1050-1450 min, yellow allow). (Scale bar; 1 µm) |
| Time-lapse Z-stack imaging of lipolysis and lipogenesis |
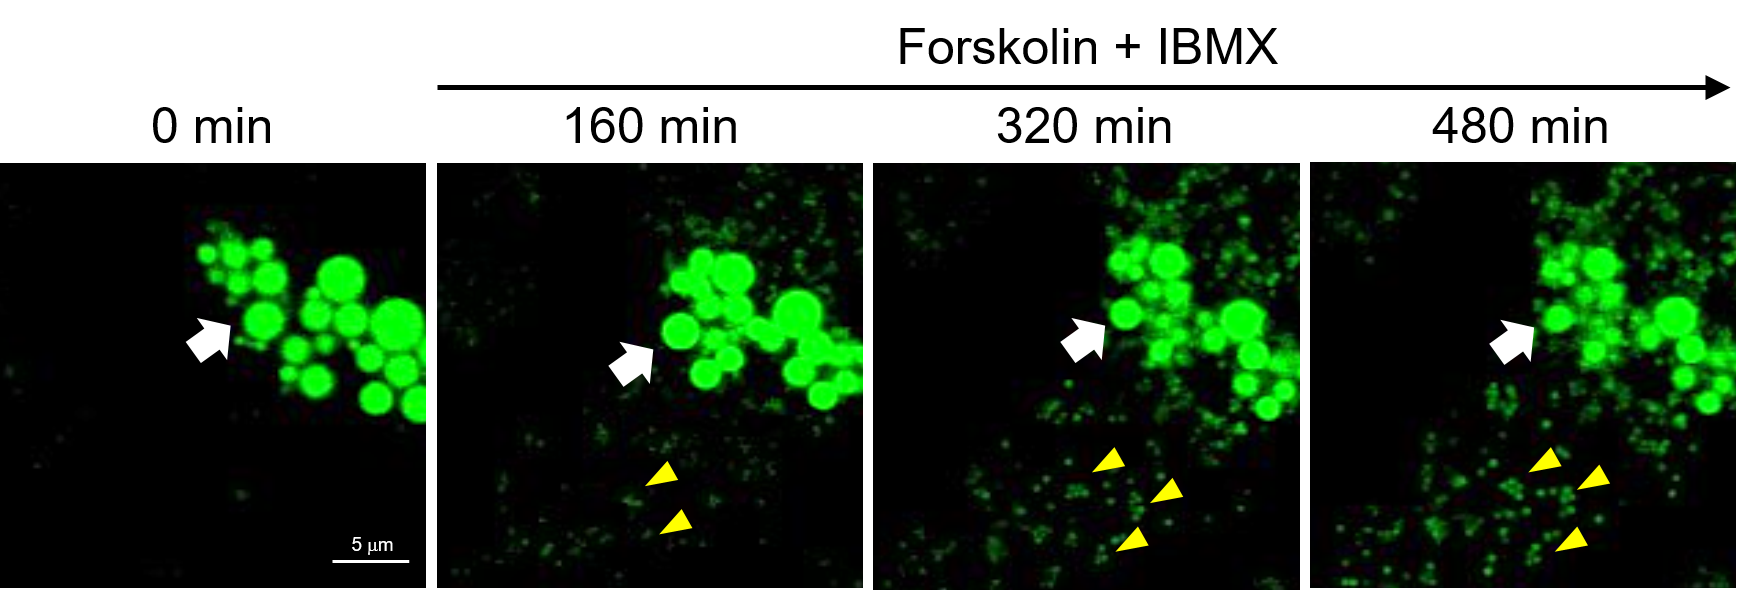 |
3T3-L1 adipocytes were incubated with 1 µM LipiDye II and washed with media to remove the free dye. After then the cells were treated with Forskolin (10 µM), an activator of adenylyl cyclases, and IBMX (100 nM), an inhibitor of phosphodiesterases. These drugs increased the intracellular concentration of cAMP and subsequently promoted the hydrolysis of triacylglycerols. Immediately after the addition of drugs, time-lapse Z-stack imaging (15 z-images/4 min, for 800 min, total 3000 images) were performed by confocal microscopy (Ex. 473 nm/Em 490-540 nm). Some large LDs clearly contracted or disappeared caused by the drugs. After two hours, numerous newly formed small LDs were observed. ( Scale bar; 5 µm) |
| Live-cell STED super resolution microscopy imaging |
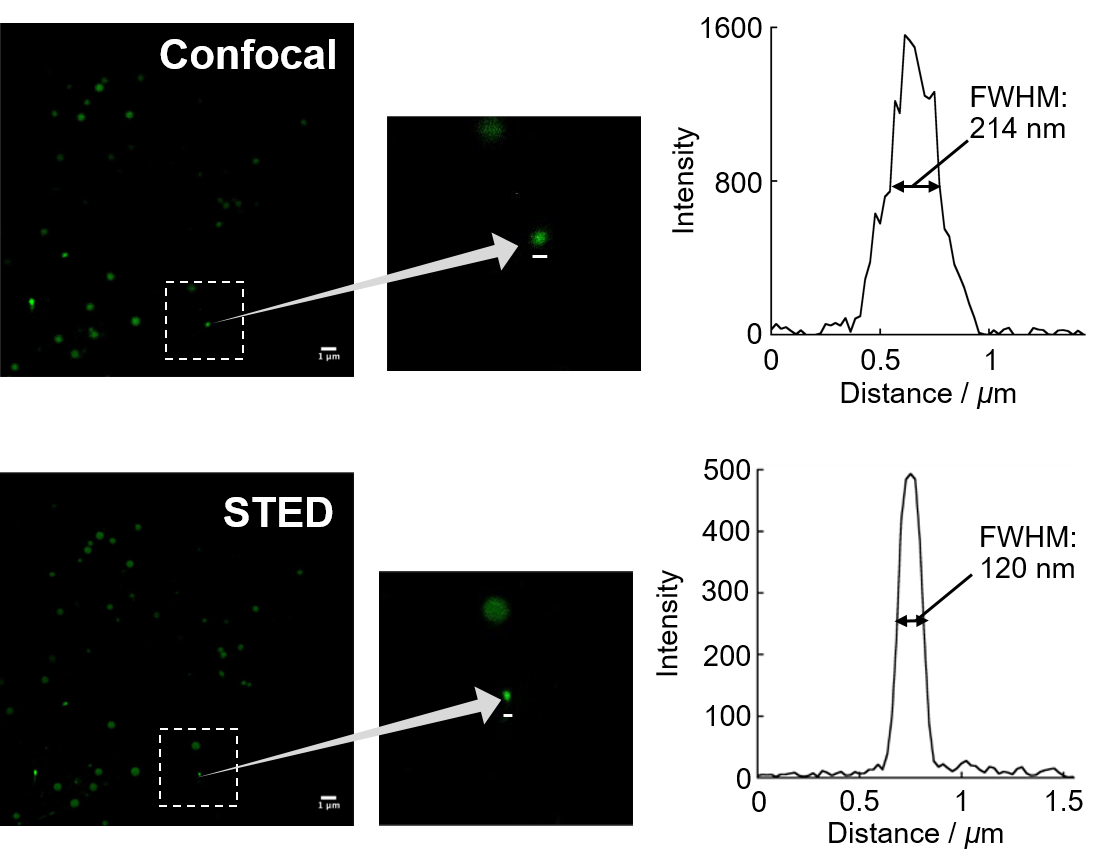 |
HeLa cells were treated with 1 µM LipiDye II, washed and culture d in medium. The cells were imaged by confocal laser microscopy (Ex 473 nm/ Em 490-540 nm) and STED microscopy (Ex 473 nm/ Em 500-640 nm, depletion laser 660 nm). STED imaging detected ~120 nm (FWHM) small LD which was not clearly detected by confocal microscopy. Detailed STED imaging condition and analysis methods were described in Ref.1. ( Scale bar 1 µm) |
| Two-photon Imaging of Microglial LDs |
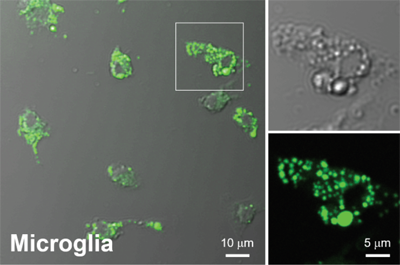 |
| Rat primary cultured microglia were treated with 1 μM LipiDye II overnight and then fixed with 4% PFA. The cells were observed by two-photon microscopy (Ex. 800 nm/Em. 510-560 nm). LipiDye II could be excited by two-photon system and detect various sizes of LDs in microglia. *The data was provided by Dr. Hyun Beom Choi and Dr. Brian MacVicar, The University of British Columbia". |
Reference
1. Taki et al.,ACS. Mater. Lett.., in press, A Fused Thiophene-S,S,-dioxide-based Super-photostable Fluorescent Marker for Lipid Droplets
2. Suzuki M et al., 2022, bioRxiv. A Drosophila model of diabetic neuropathy reveals a crucial role of proteasome activity in the glia
3. Kajiwara K et al., A negative-solvatochromic fluorescent probe for visualizing intracellular distributions of fatty acid metabolites. Nat Commun. 2022 May 9;13(1):2533. doi: 10.1038/s41467-022-30153-6.
4. Kim S et al., Potential Role of Pig UCP3 in Modulating Adipocyte Browning via the Beta-Adrenergic Receptor Signaling Pathway. Biology 2024, 13(5), 284.
5. Shimasaki K et al., A high-resolution phase-contrast microscopy system for label-free imaging in living cells. Cell Struct Funct. 2024 Jun 22;49(1):21-29.
6. Petrelli F et al., An optimized method to visualize lipid droplets in brain tissue demonstrates their substantial accumulation in aged brains. bioRxiv preprint doi: https://doi.org/10.1101/2024.06.12.598519; this version posted June 13, 2024
7. Yasa, S., Butz, E. S., Colombo, A., Chandrachud, U., Montore, L., Tschirner, S., ... & Cotman, S. L. (2024). Loss of CLN3 in microglia leads to impaired lipid metabolism and myelin turnover. Communications Biology, 7(1), 1373.
8. Nishizawa, H., Funasaki, S., Ma, W., Kubota, Y., Watanabe, K., Arima, Y., Kuroda, S., Ito, T., Furuya, M., Motoshima, T., Nishiyama, A., Mehanna, S., Satou, Y., Hasumi, H., Jikuya, R., Makiyama, K., Tamura, T., Oike, Y., Tanaka, Y., Suda, T., … Kamba, T. (2025). HIF1α Plays a Crucial Role in the Development of TFE3-Rearranged Renal Cell Carcinoma by Orchestrating a Metabolic Shift Toward Fatty Acid Synthesis. Genes to cells : devoted to molecular & cellular mechanisms, 30(1), e13195. https://doi.org/10.1111/gtc.13195
9. Shimasaki, K., Okemoto-Nakamura, Y., Saito, K., Fukasawa, M., Katoh, K., & Hanada, K. (2024). Deep learning-based segmentation of subcellular organelles in high-resolution phase-contrast images. Cell Structure and Function, 49(2), 57–65. https://doi.org/10.1247/csf.24036
10. Vidal, J., Fernandez, E. A., Wohlwend, M., Laurila, P.-P., Lopez-Mejia, A., Ochala, J., Lobrinus, A. J., Kayser, B., Lopez-Mejia, I. C., Place, N., & Zanou, N. (2023). Ryanodine receptor type 1 content decrease-induced endoplasmic reticulum stress is a hallmark of myopathies. Journal of Cachexia, Sarcopenia and Muscle, 14(6), 2882–2897. https://doi.org/10.1002/jcsm.13349
11. Jin, S., Kim, J.-G., Kim, H. J., Kim, J. Y., Kim, S. H., Kang, H. C., & Kim, M. J. (2025). miRNA408 from Camellia japonica L. mediates cross-kingdom regulation in human skin recovery. Biomolecules, 15(8), 1108. https://doi.org/10.3390/biom15081108
12. Matsuda, S., Ohno, M., Nishi, K., Ikeda, S., Iwasaki, H., Eifuku, T., Hiraoka, Y., Kimura, T., Ono, K., & Nishi, E. (2025). Nardilysin in adipocyte regulates insulin sensitivity via HIF1α and PPARγ. Scientific Reports, 15(1), 37415. https://doi.org/10.1038/s41598-025-21276-z
13. Kurosawa, T., Ikemoto-Uezumi, M., Yoshimoto, Y., Minato, K., Kaji, N., Chaen, T., Hase, E., Minamikawa, T., Yasui, T., Horiguchi, K., Iino, S., Hori, M., & Uezumi, A. (2024). Tissue?specific functions of MSCs are linked to homeostatic muscle maintenance and alter with aging. Aging Cell, 23(11), e14299. https://doi.org/10.1111/acel.14299
14. Cho, Jimin, et al. "Label-Free 4D Holotomography with Depth-Adaptive Segmentation for Quantitative Analysis of Lipid Droplet Dynamics in Hepatic Organoids." Biophotonics Discovery, vol. 3, no. 3, 2026, p. 035005. Crossref, https://doi.org/10.1117/1.BIOS.3.3.035005.
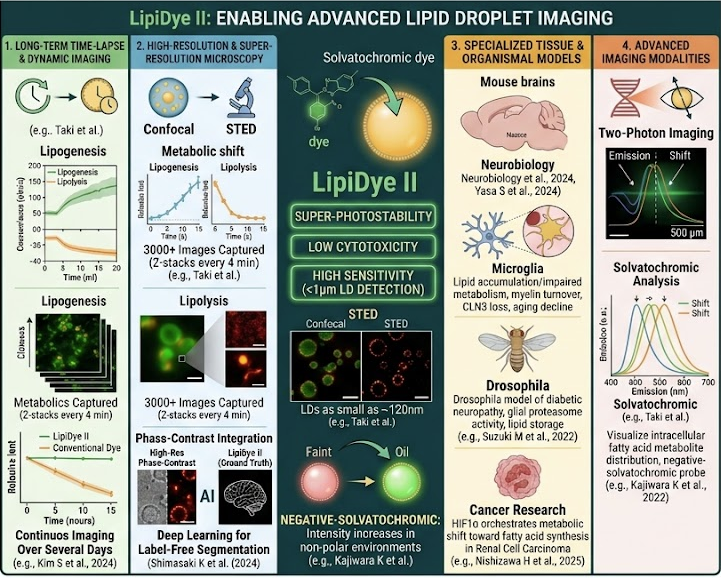
Based on the publications and the product documentation for LipiDye II, researchers have utilized this dye across a variety of advanced imaging applications. Its primary appeal in these studies is its super-photostability, low cytotoxicity, and high sensitivity for detecting lipid droplets (LDs) smaller than 1 $\mu$m.
Below is a summary of how researchers have applied LipiDye II in their work:
1. Long-Term Time-Lapse & Dynamic Imaging
-
Adipocyte Differentiation: Researchers (e.g., Kim S et al., 2024) used the dye to monitor the long-term synthesis and growth of LDs during the differentiation of 3T3-L1 cells. Because of its stability, they could perform continuous imaging over several days, exchanging media containing 1 $\mu$M of dye every 48 hours.
-
Metabolic Shifts (Lipolysis): Studies tracked the degradation of LDs in real-time. By stimulating cells with drugs like Forskolin and IBMX, researchers captured 3,000+ images (Z-stacks every 4 minutes) to visualize large LDs contracting and the de novo synthesis of tiny, new LDs.
2. High-Resolution & Super-Resolution Microscopy
-
STED Microscopy: In the foundational study by Taki et al., LipiDye II was used with STED (Stimulated Emission Depletion) to bypass the diffraction limit. Researchers successfully detected LDs as small as ~120 nm in HeLa cells, which are typically invisible under standard confocal microscopy.
-
Phase-Contrast Integration: Shimasaki K et al. (2024) used the dye as a ground-truth marker to train deep-learning models for label-free organelle segmentation in high-resolution phase-contrast images.
3. Specialized Tissue & Organismal Models
-
Neurobiology and Aging: Petrelli F et al. (2024) and Yasa S et al. (2024) used the dye to visualize substantial LD accumulation in microglia and brain tissue. This helped demonstrate how lipid metabolism impairment (e.g., loss of CLN3) leads to myelin turnover issues and aging-related decline.
-
Disease Models: In Suzuki M et al. (2022), the dye was used in a Drosophila model to study diabetic neuropathy, specifically looking at how proteasome activity in the glia affects lipid storage and health.
-
Cancer Research: Nishizawa H et al. (2025) applied the dye to show how HIF1$\alpha$ orchestrates a metabolic shift toward fatty acid synthesis in Renal Cell Carcinoma.
4. Advanced Imaging Modalities
-
Two-Photon Imaging: In collaboration with the University of British Columbia, researchers used Two-Photon microscopy (Ex. 800 nm) to image LDs in primary cultured microglia, taking advantage of the dye's deep-tissue penetration capabilities.
-
Solvatochromic Analysis: Kajiwara K et al. (2022) leveraged the dye’s negative-solvatochromic properties to visualize the intracellular distribution of fatty acid metabolites, as the dye's fluorescence intensity specifically increases only in non-polar (lipid-rich) environments.

<more info.>
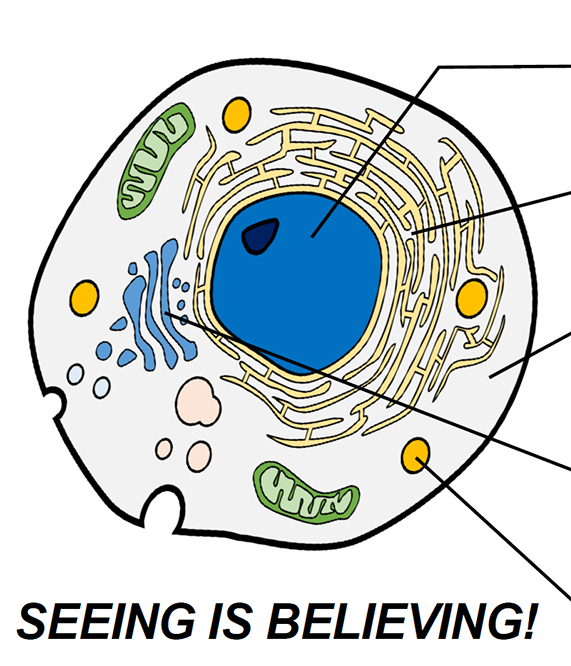
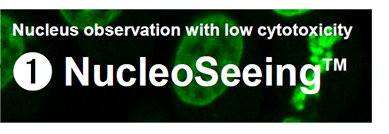
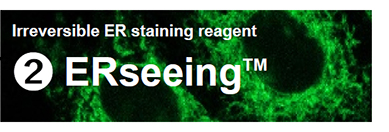
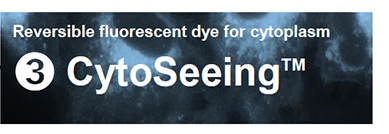
Organelle Imaging Dye in Living Cells
 |
 |
 |
|
 |
|
 |
|
 |
Full PDF Document Download, Click here "Organelle Imaging Dye in Living Cells"