

LipiDye RED, Lipid Droplet Live Imaging Red
Product#: FNK-FDV-0057
$397.67
Availability:
Ships in 1-2 Weeks
LipiDye RED, Lipid Droplet Live Imaging Red
Cat.No: FNK-FDV-0057
Size: 0.05 mg
Storage: Room Temperature
Description
LipiDye™ RED is a reagent that enables high-sensitivity red-fluorescent imaging of lipid droplets in live cells. In addition to its high specificity for lipid droplets, it exhibits low cytotoxicity and exceptional photostability, making it well suited for long-term imaging and dynamic analysis of lipid droplets. Furthermore, by using fluorescence lifetime imaging, it allows analysis of the lipid composition of individual lipid droplets and the progression of lipid hydrolysis.
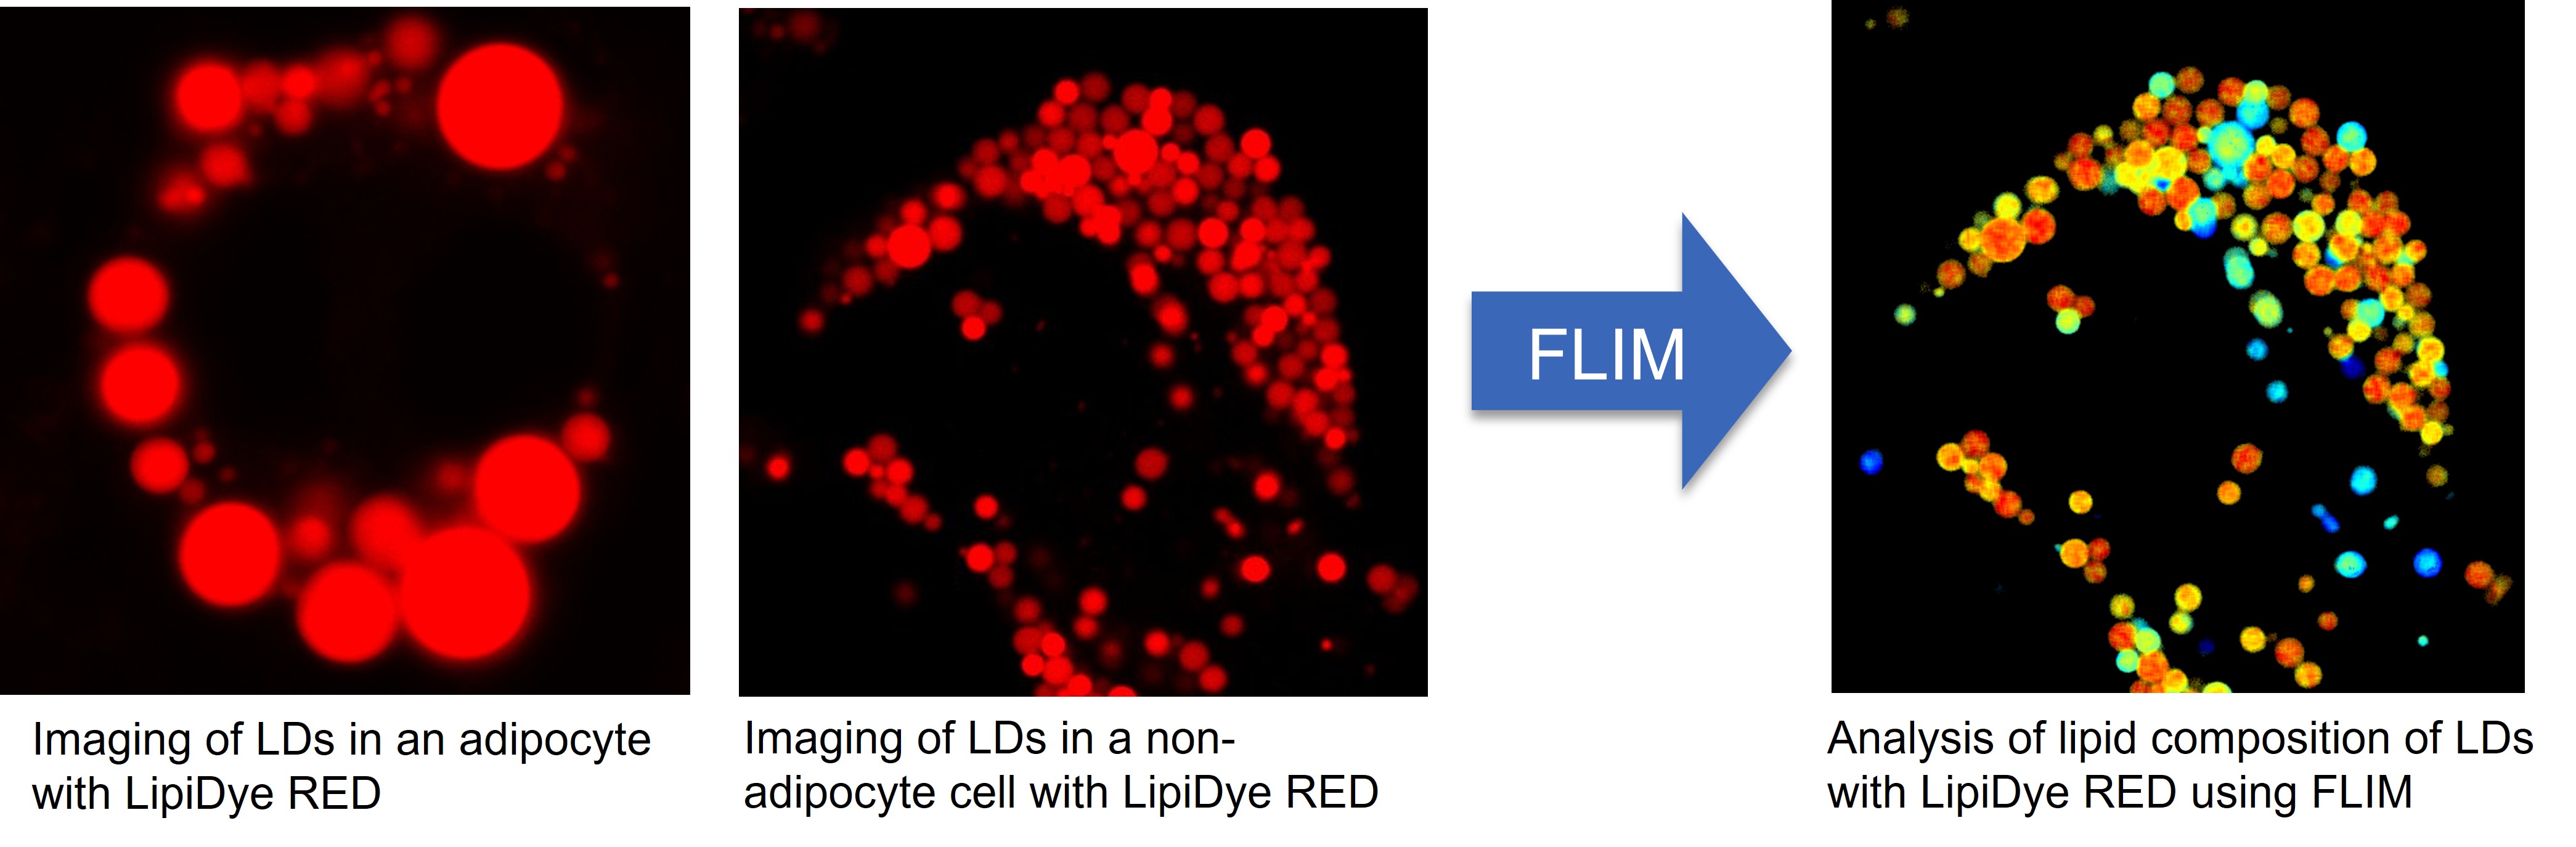
These lipid droplet degradation mechanisms are regulated according to the energy demands of cells and organisms. Fatty acids released through lipid droplet breakdown undergo β-oxidation in mitochondria and are converted into the chemical energy molecule ATP. Notably, one molecule of TAG releases three molecules of fatty acids upon hydrolysis. Because disruption of lipid droplet degradation is known to cause various metabolic diseases, analyzing the progression of lipid droplet degradation and the lipid composition of lipid droplets is of great importance.
Traditionally, lipid composition has been analyzed by extracting lipids from cells or tissues followed by analysis using techniques such as LC/MS/MS. However, this approach is labor-intensive and results in the loss of spatial information regarding lipid droplet composition. In addition, while conventional lipid droplet staining probes allow observation of the spatial distribution and size of lipid droplets, they do not provide information on the lipid composition or degradation state of individual lipid droplets.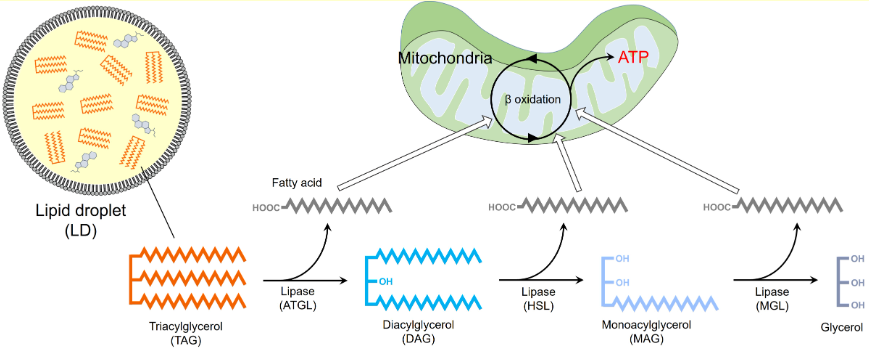
LipiDye™ RED can be used not only as a red-fluorescent lipid droplet staining probe but also for analyzing the lipid composition of lipid droplets when combined with fluorescence lifetime imaging microscopy (FLIM). In general, lipid droplets exist in a highly nonpolar environment; however, their polarity gradually increases as lipid hydrolysis alters their lipid composition. Because LipiDye™ RED exhibits changes in fluorescence lifetime depending on the polarity of the surrounding environment, its fluorescence lifetime varies according to the extent of lipid droplet hydrolysis.
Specifically, lipid droplets in a low-polarity environment with a high proportion of TAG exhibit a longer fluorescence lifetime. In contrast, lipid droplets in a relatively higher-polarity environment, where the proportion of DAG increases due to hydrolysis, show a shorter fluorescence lifetime. By taking advantage of this property, cells stained with LipiDye™ RED can be observed using fluorescence lifetime imaging microscopy, allowing the lipid composition of individual lipid droplets to be visualized as differences in fluorescence lifetime.
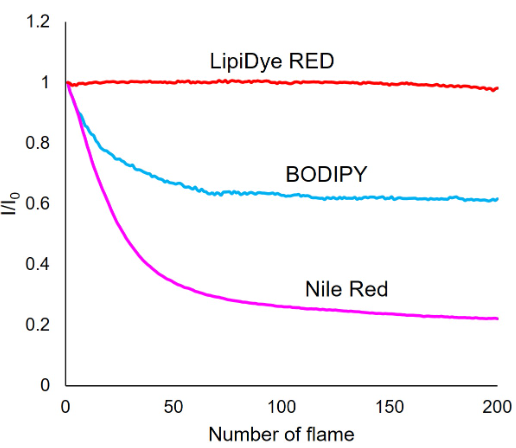
Furthermore, LipiDye™ RED has high photostability and strong intracellular retention, enabling long-term imaging. This makes it possible to analyze the progression of lipid droplet hydrolysis both spatially and temporally.
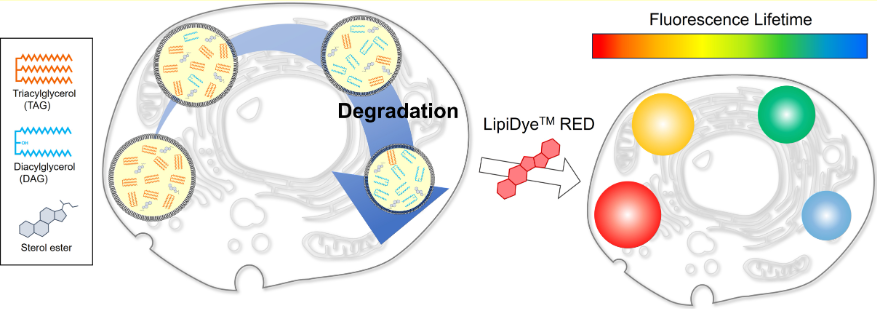
Analysis of lipid composition dynamics in lipid droplets using LipiDye™ RED
As described above, lipid droplets are mainly composed of triacylglycerols (TAGs) and sterol esters. TAGs are hydrolyzed by lipases into fatty acids and diacylglycerols (DAGs), and DAGs are further sequentially degraded into monoacylglycerols (MAGs) and glycerol (lipolysis). During this process, the lipid composition of lipid droplets dynamically changes from a TAG-dominant state to one with a higher proportion of DAG. In addition, a metabolic process known as "lipophagy", in which lipid droplets are degraded through autophagy, has also been reported.These lipid droplet degradation mechanisms are regulated according to the energy demands of cells and organisms. Fatty acids released through lipid droplet breakdown undergo β-oxidation in mitochondria and are converted into the chemical energy molecule ATP. Notably, one molecule of TAG releases three molecules of fatty acids upon hydrolysis. Because disruption of lipid droplet degradation is known to cause various metabolic diseases, analyzing the progression of lipid droplet degradation and the lipid composition of lipid droplets is of great importance.
Traditionally, lipid composition has been analyzed by extracting lipids from cells or tissues followed by analysis using techniques such as LC/MS/MS. However, this approach is labor-intensive and results in the loss of spatial information regarding lipid droplet composition. In addition, while conventional lipid droplet staining probes allow observation of the spatial distribution and size of lipid droplets, they do not provide information on the lipid composition or degradation state of individual lipid droplets.
Specifically, lipid droplets in a low-polarity environment with a high proportion of TAG exhibit a longer fluorescence lifetime. In contrast, lipid droplets in a relatively higher-polarity environment, where the proportion of DAG increases due to hydrolysis, show a shorter fluorescence lifetime. By taking advantage of this property, cells stained with LipiDye™ RED can be observed using fluorescence lifetime imaging microscopy, allowing the lipid composition of individual lipid droplets to be visualized as differences in fluorescence lifetime.
Furthermore, LipiDye™ RED has high photostability and strong intracellular retention, enabling long-term imaging. This makes it possible to analyze the progression of lipid droplet hydrolysis both spatially and temporally.
Comparison of LipiDye™ series with Conventional Reagents
| Name | Excitation Wavelength | Flourescence Wavelength (Fkuorecence Color) | Staining | Multicolor Imaging | S/N Ratio | Photo-Stability | Time-Lapse Imaging | Analysis of Lipid Composition Dynamics | |
| Fixed Cells | Live Cells | ||||||||
| LipiDyeTM RED | 470-560 nm | 550-700 nm (RED) | Yes | Yes (Wavelength Selection Warning) | High | Extermely High | Extermely Long Time | Flourescence Lifetime Imaging Mircoscopy (FLIM) | |
| LipiDyeTM II | 400-500 nm | 490-600 nm (GREEN) | Yes | Yes (Wavelength Selection Warning) | High | Extermely High | Extermely Long Time | No | |
| Flourescnce B | -490 nm | 510 nm (GREEN) | Yes | Yes | Middle | Low | Yes | No | |
| Nile Red | -510 nm | 631 (RED) | Yes | Not Suitable | Low | Low | Not Suitable | No | |
| LDs Staining Dye A | - | RED/GREEN | Yes | Yes | High | - | No | No | |
| Oil Red O | - | RED Dye | No | Yes | - | Low | - | No | No |
Features
In addition to the selective enrichment to LDs, this probe emits light in response to a hydrophobic environment, thus suppressing emission in the cytoplasm, etc. and showing a high signal-to-noise ratio for LDs.
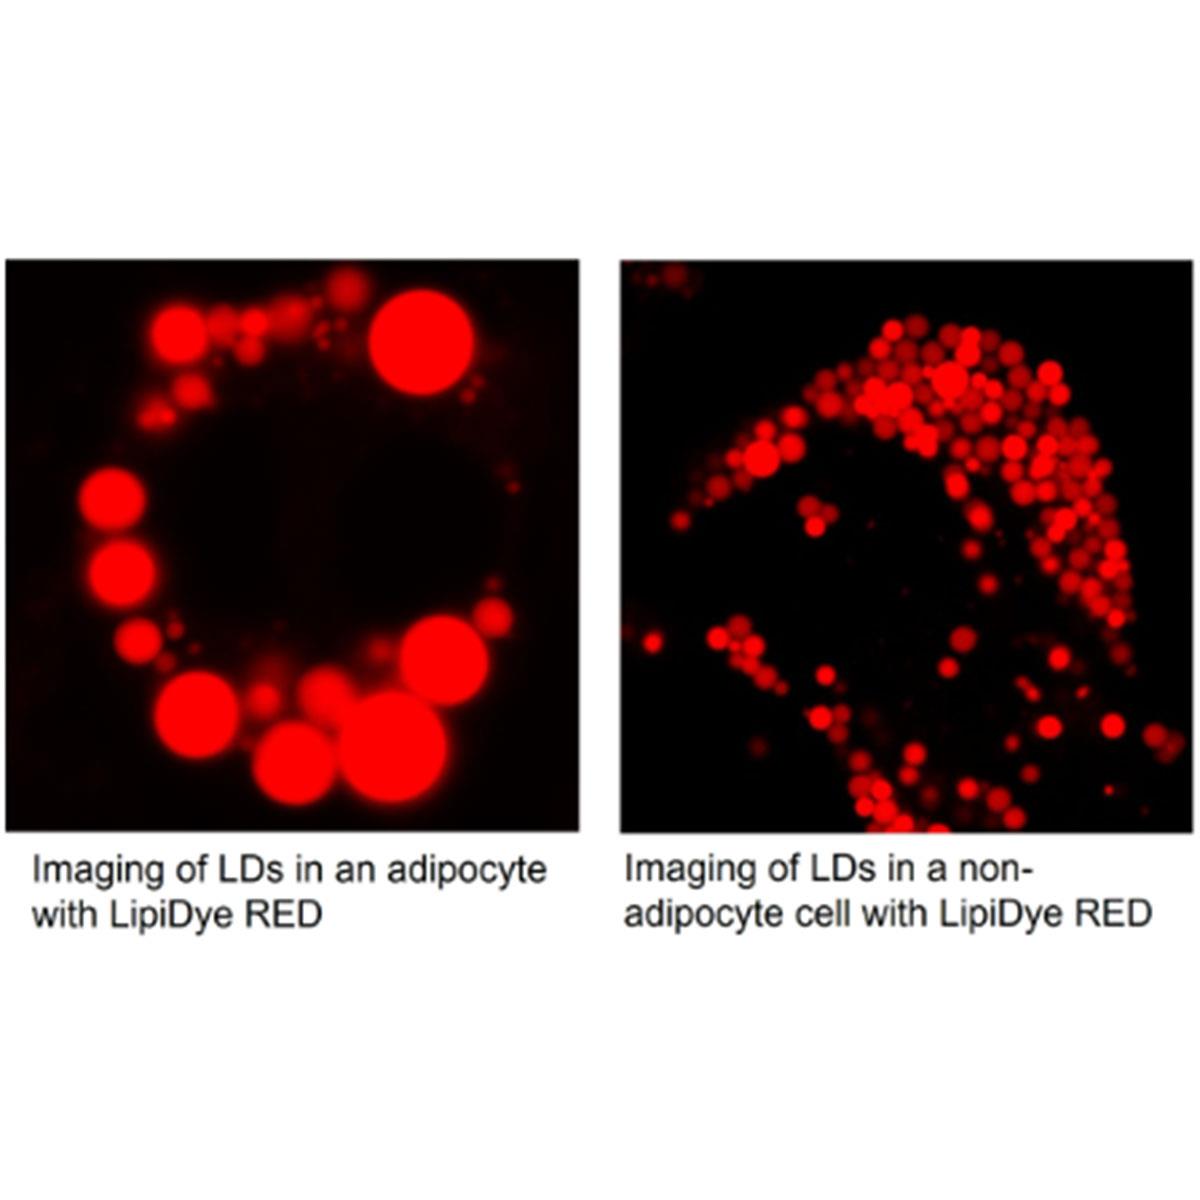
- Capable of detecting small LDs (<1 μm) in non-adipocytes.
- It exhibits extremely high photostability and is excellent for long-time live cell imaging.
- At the recommended use concentration (0.1-5 μM), it shows almost no cytotoxicity.
- Can be used for both live cells and fixed cells. Fixation treatment after staining of living cells is also possible.
- Applicable to STED super resolution microscopy.
- Excitation/Fluorescence wavelengths: 470-560 nm / 550-700 nm (See below)
- Lipid composition of lipid droplets can be evaluated using fluorescence lifetime imaging microscopy (FLIM)
Fluorescent Characteristics
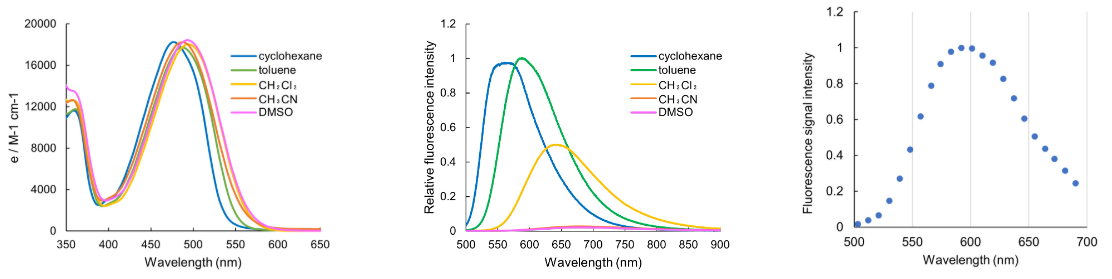
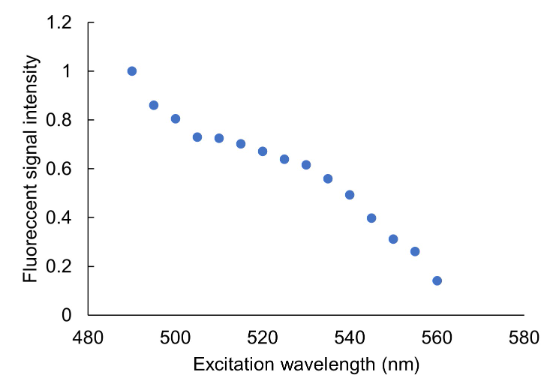
The absorption maximum is between 470–520 nm, but excitation is also possible with light sources in the 520–560 nm range. For details, please refer to the excitation and emission spectra as well as data on applicable excitation wavelengths. Multiplex staining with blue- or green-fluorescent dyes is also possible, but careful wavelength selection is required. In particular, when performing multiplex staining with green dyes (e.g., FITC, GFP) and using a 488 nm laser to excite the green dye, LipiDye™ RED will also be excited. Therefore, to selectively detect green dyes in multiplex experiments, use a bandpass filter that blocks fluorescence above 520 nm.
Conversely, to selectively detect LipiDye™ RED, excite with a 514 nm or 532 nm laser and use a filter that blocks fluorescence below 560 nm.
Conversely, to selectively detect LipiDye™ RED, excite with a 514 nm or 532 nm laser and use a filter that blocks fluorescence below 560 nm.
Eamples of Light Sources
- Lasers: 458 nm, 473 nm, 488 nm, 514 nm, 532 nm, 561 nm, 561 nm laser can excite LipiDye™ RED but shows weak fluorescence compared with other excitations. When using a 561 nm laser, empirically optimize imaging conditions such as dye concentration, etc., for your experiments.
- Light source (Xenon lamp or LED) + filters: Commercial Alexa555 or RFP filters are available.
- STED super resolution microscopy: Recommended excitation light: 488 nm laser, STED light: 775 nm laser.
Reference Data
Excitation / Flourescence spectrum
 |
||
| Absorption spectrum of LipiDye™ RED | Fluorescence spectrum of LipiDye™ RED | Fluorescence spectrum of Lipid Droplets stained with LipiDye™ RED |
| The absorption spectrum of LipiDye™ RED is largely unaffected by the solvent and shows absorption in the 430–550 nm range. | LipiDye™ RED is a solvatochromic dye, meaning its fluorescence properties change depending on the polarity of the surrounding environment. In hydrophobic environments such as cyclohexane or toluene, it exhibits strong orange-to-red fluorescence. In contrast, in highly polar environments such as acetonitrile or DMSO, the fluorescence maximum shifts to longer wavelengths and the fluorescence intensity is significantly reduced. This property enables the selective observation of red fluorescence derived from the hydrophobic environment of lipid droplets. | When cells are stained with LipiDye™ RED and the lipid droplet regions are analyzed by spectral scanning microscopy, a fluorescence spectrum with a maximum around 600 nm is observed. |
 |
 |
| Applicability of excitation wavelength | Photostability |
| LipiDye™ RED was used to stain LDs in HepG2 cells, and red fluorescence (λem = 580-750 nm) intensity was measured with several different excitation lasers was detected using a confocal laser scanning microscope. | After staining HeLa cells with LipiDye™ RED, Nile Red, and BODIPY493/503, images were repeatedly acquired using a high-power laser (500 nm) using a confocal laser scanning microscope, and changes in fluorescence intensity were observed. In contrast to Nile Red and BODIPY493/503, whose fluorescence attenuated significantly after multiple image acquisitions, LipiDye™ RED showed almost no change in fluorescence intensity even after a total of 200 image acquisitions. |
Changes in Flourescence Lifetime Depending on Lipid Composition
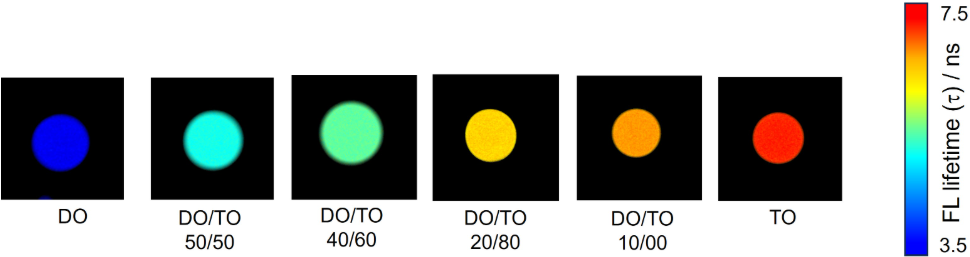 |
| Artificial LDs with varying composition ratios of triolein (TO), a typical TAG, and diolein (DO), a typical DAG, were stained with LipiDye™ RED, and their fluorescence lifetime imaging was observed. The results showed that the higher the DO ratio, the shorter the fluorescence lifetime, and the higher the TO ratio, the longer the fluorescence lifetime (τ = 4.1 ns to 7.5 ns). This indicates the DAG/TAG ratio of LDs can be evaluated using the fluorescence lifetime of LipiDye™ RED. Fluorescence lifetime is expressed in pseudo-color. |
Cytotoxicity
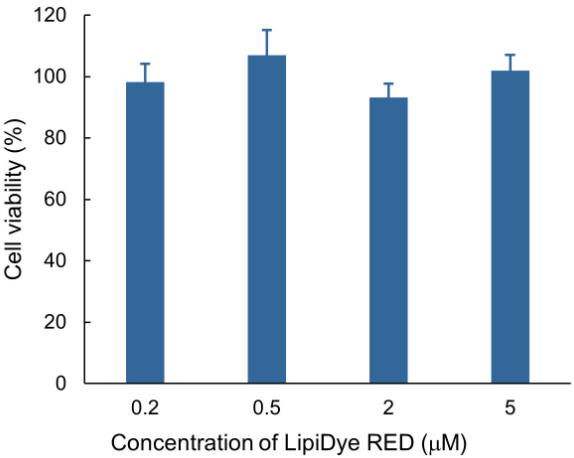 |
HeLa cells were treated with various concentrations of LipiDye™ RED for 24 hours. After incubation, cell viability was evaluated by MTT assay. The concentration range (0.2-5 μM) showed little cytotoxicity in cells. |
Living / Fixed Cells Staining
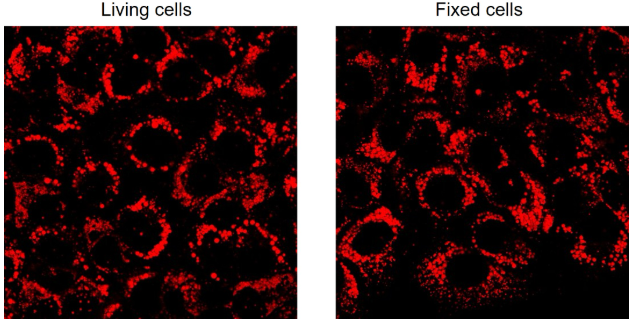 |
Huh-7 cells treated with oleic acid to form LDs were stained with LipiDye™ RED and fixed with 4% paraformaldehyde. Almost no change in the fluorescence signal was observed before and after the fixation treatment. It has been shown that LipiDye™ RED can be used for co-staining with immunostaining after fixing cells. |
Reference
- Wang, J., et al., "Single-Cell Fluorescence Analysis of Lipid Droplet Compositional Dynamics during Triacylglycerol Catabolism", J. Am. Chem. Soc.、 147, 41514-41523(2025). [PMID:41065230]